Published: November 10, 2026
Almost one South African in four speaks isiZulu at home. That single fact shapes the country's politics, its languages and its culture more than any other, and this ranking shows how far ahead the lead is. South Africa is unusual in Africa: its census does not count tribes at all, so this ranking is built on the closest official measure, the language spoken most often in the household.
The ranking applies the first-language shares from Statistics South Africa's Census 2022 to South Africa's 2026 population of 65,453,084 from the United Nations World Population Prospects 2024. Only the nine indigenous African-language groups are ranked. Afrikaans and English, the third and fifth most spoken home languages, are colonial languages rather than tribal groups, so they are left out, and the Methodology explains why no tenth group can honestly be added. This is the third entry in our series ranking the tribes of every African country, after Nigeria and Ghana.
Key Facts
- The Zulu rank first with 16.0 million people, 24.4 percent of South Africa, 1.50 times the Xhosa in second place.
- The Zulu and Xhosa together number 26.6 million people, 40.7 percent of the country, two in every five South Africans.
- The top three groups pass half the country: Zulu, Xhosa and Sepedi together are 33.2 million people, 50.7 percent.
- The nine ranked groups together cover 51.4 million people, 78.5 percent of South Africa. The rest is mostly Afrikaans and English speakers, who are not tribal groups and are not ranked.
- The Zulu outnumber the smallest ranked group, the Ndebele, by more than 14 times, 16.0 million people against 1.1 million.
| Rank | Tribe | Share of South Africa | Population (2026) | Main Homeland |
|---|---|---|---|---|
| 1 | Zulu (isiZulu) | 24.4% | 15,970,552 | KwaZulu-Natal and Gauteng |
| 2 | Xhosa (isiXhosa) | 16.3% | 10,668,853 | Eastern Cape and Western Cape |
| 3 | Sepedi (Pedi / Northern Sotho) | 10.0% | 6,545,308 | Limpopo |
| 4 | Setswana (Tswana) | 8.3% | 5,432,606 | North West and Northern Cape |
| 5 | Sesotho (Southern Sotho) | 7.8% | 5,105,341 | Free State and Gauteng |
| 6 | Xitsonga (Tsonga) | 4.7% | 3,076,295 | Limpopo and Mpumalanga |
| 7 | siSwati (Swati) | 2.8% | 1,832,686 | Mpumalanga |
| 8 | Tshivenda (Venda) | 2.5% | 1,636,327 | Limpopo |
| 9 | isiNdebele (Ndebele) | 1.7% | 1,112,702 | Mpumalanga and Gauteng |
The shares in this table are Census 2022 first-language shares, applied to the 2026 population. They are a language-based proxy for ethnic groups, not a direct count of tribe, and the Methodology explains the limits. Afrikaans, at 10.6 percent, and English, at 8.7 percent, are the third and fifth most spoken home languages in the country, but neither is a tribal group, so neither is ranked. The census "Other" category, 2.1 percent, is a residual bucket of smaller languages, not a single group, so it cannot take a rank either.
The two famous names just outside the ranking are therefore languages, not peoples. Afrikaans would sit third at 6,938,027 people if every home language were ranked, and English would sit fifth at 5,694,418. Together they number 12,632,445 people, 19.3 percent of the country, still fewer than the Zulu alone. No tenth indigenous group exists in the census to complete a top 10: all eleven official languages are accounted for, nine ranked here and two excluded, with South African Sign Language at 0.02 percent.
1. Zulu: 15,970,552
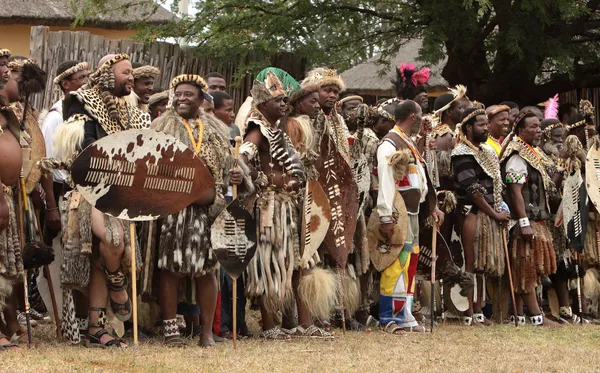
The Zulu are South Africa's largest people by a distance. IsiZulu is the home language of 80 percent of KwaZulu-Natal and 23 percent of Gauteng, the economic heartland, and the Zulu lead the Xhosa by 5,301,699 people. The Zulu kingdom rose to power under Shaka in the early 19th century, and the monarchy still anchors Zulu identity today. The cover photograph shows the Umhlanga reed dance, held every September at the royal residence in Nongoma, where thousands of maidens gather in traditional dress. At 24.4 percent of the country, the Zulu alone outnumber ranks 5 to 9 combined.
2. Xhosa: 10,668,853
The Xhosa hold the Eastern Cape, where isiXhosa is the home language of 81.8 percent of the province, and they are also the largest group in the Western Cape at 31.4 percent. Nelson Mandela, South Africa's first democratic president, was Xhosa, of the Thembu royal line. IsiXhosa is famous for its click consonants, shared with the Khoi and San languages of the region. At 16.3 percent, the Xhosa are the only group besides the Zulu above one in ten South Africans.
3. Sepedi: 6,545,308
The Sepedi, also called the Pedi or Northern Sotho, are the people of Limpopo, where Sepedi is the home language of 55.5 percent of the province. Their historic kingdom, centred on Sekhukhune, resisted both Boer and British expansion in the 19th century. At exactly 10.0 percent, the Sepedi are the last group in double digits, and they complete the top three that together pass half the country.
4. Setswana: 5,432,606
The Setswana, or Tswana, are the people of the North West, and their homeland continues across the border into Botswana, where the Tswana are the majority people. At 8.3 percent and 5.4 million people, they are the largest of the three Sotho groups, ahead of Sesotho by 327,265 people. Setswana is also one of Botswana's two official languages, which makes the Tswana one of the few peoples in this ranking whose homeland spans two states.
5. Sesotho: 5,105,341
The Sesotho, or Southern Sotho, are the people of the Free State, where Sesotho is the home language of 72.3 percent of the province, and of Gauteng, where they number 13.1 percent. Sesotho is also the national language of Lesotho, the mountain kingdom entirely surrounded by South Africa, whose people are Basotho. At 7.8 percent, the Sesotho close the top five, which together hold two in three South Africans.
6. Xitsonga: 3,076,295
The Xitsonga, or Tsonga, live mainly in Limpopo and Mpumalanga, and their homeland continues into southern Mozambique, where Tsonga speakers are also numerous. The Xibelani dance, performed in bright layered skirts, is one of the best known Tsonga traditions. At 4.7 percent and 3.1 million people, the Tsonga are the largest group in the lower half of the table, nearly 1.7 times the next group below them.
7. siSwati: 1,832,686
The siSwati, or Swati, are the people of Mpumalanga, where siSwati is the home language of 30.5 percent of the province. SiSwati is also the national language of Eswatini, where the Umhlanga reed dance is held in the same season as the Zulu ceremony in the cover photograph. At 2.8 percent, the Swati are the first group below two million people.
8. Tshivenda: 1,636,327
The Tshivenda, or Venda, live in the far north-east of Limpopo, in the Soutpansberg and the land below it. They are the smallest of the large language groups in the north, and their homeland is one of the most compact in the table. At 2.5 percent and 1.6 million people, the Venda sit 523,625 people ahead of the Ndebele at the foot of the ranking.
9. isiNdebele: 1,112,702
The isiNdebele, or Ndebele, are the smallest ranked group, at 1.7 percent and 1.1 million people, spread across Mpumalanga and Gauteng. South Africa's amaNdebele are distinct from the larger Ndebele of Zimbabwe, though both trace to Nguni roots. Ndebele beadwork and the bold geometric painting of Ndebele homesteads are among the most recognised art forms in South Africa. The Ndebele close an honest top nine: no tenth indigenous group exists in the census to follow them.
Frequently Asked Questions
Why is this a Top 9 and not a Top 10?
Because only nine indigenous African-language groups can be verified in South Africa's census. The census counts eleven official languages, and the two not ranked, Afrikaans and English, are colonial languages rather than tribal groups. The census "Other" bucket is a residual of smaller languages, not a single group, so it cannot fill the tenth slot. Publishing a tenth name would mean inventing a group, so this ranking stops at nine and says so.
Does South Africa's census really count tribes?
No. Statistics South Africa asks which language is spoken most often in the household, and it publishes no ethnic breakdown below the four broad groups in the CIA World Factbook: Black African 80.9 percent, Coloured 8.8 percent, White 7.8 percent and Indian or Asian 2.6 percent. This ranking therefore uses first language as a proxy for ethnic and linguistic groups, and every figure is labelled that way. Not every isiZulu speaker is ethnically Zulu, and Afrikaans is spoken by Coloured and White South Africans alike.
Why are Afrikaans and English left out?
Because they are not tribal groups. Afrikaans, at 10.6 percent and 6,938,027 people, would rank third if every home language were ranked, and English, at 8.7 percent and 5,694,418 people, would rank fifth. Both arrived with colonial settlement and are spoken across ethnic lines, so ranking them as tribes would mislabel them. They are reported here in full so readers can see exactly what was left out and why.
Why are Sepedi, Sesotho and Setswana ranked separately?
Because they are three distinct peoples with separate homelands and histories: the Pedi in Limpopo, the Tswana in the North West and the Sotho in the Free State. Their languages are closely related, all three are Sotho languages, but merging them would hide real groups and produce a false second place. The census counts them separately, and this ranking follows the census.
Where do the Khoi and San peoples fit?
The Khoi and San are South Africa's first peoples, but the census gives no separate count for them. Their languages fall inside the census "Other" bucket of 2.1 percent, worth 1,374,515 people at the 2026 total, mixed with other small languages. Because that bucket is a residual and not one group, it cannot take a rank. That is a limit of the census, and it is stated here rather than papered over.
Data Sources
- Statistics South Africa, Census 2022, Statistical Release P03014, Table 2.8 (language most often spoken in the household): census.statssa.gov.za
- Statistics South Africa, Cultural Dynamics in South Africa, Report 03-01-84 (2025): statssa.gov.za
- CIA World Factbook, South Africa, languages (2018 est.): cia.gov/the-world-factbook
- BusinessTech, "These are the most spoken languages in South Africa" (October 2023), reporting the Census 2022 figures: businesstech.co.za
- Pan South African Language Board, statement on the Census 2022 language statistics (October 11, 2023): pansalb.org
- United Nations, World Population Prospects 2024 (South Africa population, 2026): population.un.org/wpp
Methodology
Every figure in the table applies a Census 2022 first-language share from Statistics South Africa (Statistical Release P03014, Table 2.8) to South Africa's 2026 population of 65,453,084 (UN World Population Prospects 2024). The census counts the language spoken most often in the household among people aged one year and older, so the ranking is a language-based proxy for ethnic and linguistic groups, not a direct count of tribe. The shares were corroborated against BusinessTech's reporting of the same census release, the Pan South African Language Board's statement and Statistics South Africa's own Cultural Dynamics report, all of which carry identical figures for the leading languages. The CIA World Factbook's 2018 language estimates carry the same set of groups and the same top two, but on an older vintage with a different order below them, so the Factbook is corroboration only and the two sources were not averaged.
Only the nine indigenous African-language groups are ranked. Afrikaans (10.6 percent) and English (8.7 percent) are the third and fifth most spoken home languages, but they are colonial languages spoken across ethnic lines, not tribal groups, so they are excluded and their figures are reported in the article so the exclusion is visible. The census "Other" category (2.1 percent) is a residual of smaller languages, including Khoi and San languages, not a single group, so it is not promoted to a rank. No Joshua Project figures are used: the census itemises all eleven official languages, so there is no gap for a second source to fill, and no subgroup count has been added on top of a family total. The nine ranked groups sum cleanly to 78.5 percent of South Africa. Every derived claim in the article (the 1.50 times Zulu lead, the top three at 50.7 percent, the top five at 66.8 percent, the Zulu outnumbering ranks 5 to 9 combined) was recomputed from the final table values by script before publication.