Published: November 20, 2026
Key Takeaways
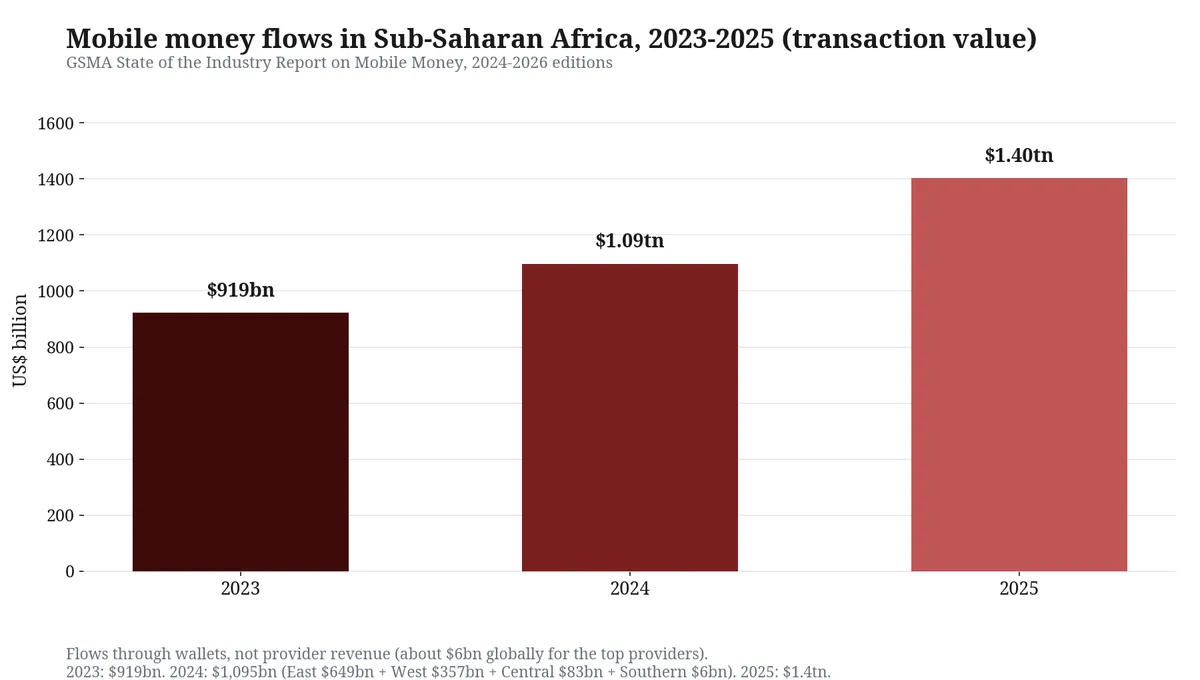
- More than $1.4 trillion moved through mobile money wallets in Sub-Saharan Africa in 2025, about two-thirds of the global total of more than $2 trillion, according to the GSMA State of the Industry Report on Mobile Money 2026. Flows have grown from $919 billion in 2023 to $1.4 trillion in 2025.
- The market is much smaller than the trillion-dollar figure suggests if you mean revenue. Providers earn fees on those flows, and the GSMA estimates revenue at about $6 billion for the top providers globally in mid-2024, while modelled "market size" reports range up to about $25 billion. This briefing leads with flows and shows the revenue range separately, because the two numbers answer different questions.
- East Africa moves the most money and West Africa has the most accounts. East Africa processed $806 billion in 2025 and West Africa $498 billion, while West Africa passed East Africa in registered accounts in 2024. Kenya's M-PESA alone moved about KES 41.6 trillion, roughly $320 billion, in the year to March 2026.
- 40% of adults in Sub-Saharan Africa held a mobile money account in 2024, up from 27% in 2021, according to the World Bank Global Findex 2025, and mobile money ownership now exceeds bank account ownership (38%). But only about a quarter of registered accounts are used each month, and three-quarters sit idle.
- The biggest change underway is interoperability by law. West Africa's central bank launched its instant payment platform PI-SPI in September 2025 and made routing through it mandatory in November 2026, while Kenya's central bank is building a national fast payment system and Ghana abolished its mobile money tax in April 2025.
Market Size & Growth
Start with the definition, because this market has two sizes and most coverage confuses them. The first size is the value of the money that flows through mobile wallets: transfers, merchant payments, bill payments, cash-in and cash-out. The second size is the revenue the providers earn from those flows, which is the fees and commissions on a small fraction of the value. The first number is in trillions. The second is in single-digit billions. This briefing uses the first as its headline size and treats the second as a separate, honestly ranged figure.
On flows, the GSMA State of the Industry Report on Mobile Money is the industry's own count and the most consistent series available. Sub-Saharan Africa processed $919 billion in 2023, $1,095 billion in 2024 and $1.4 trillion in 2025. That is growth of about 19% in 2024 and about 28% in 2025, or about 23% a year compounded across the two years. The 2024 total is the sum of the GSMA's regional figures: East Africa $649 billion, West Africa $357 billion, Central Africa $83 billion and Southern Africa $6 billion. The 2025 total is the GSMA's published figure, with East Africa at $806 billion and West Africa at $498 billion. Globally, more than $2 trillion flowed through mobile money wallets in 2025, across 2.3 billion registered accounts, of which 593 million were active in a typical month. Sub-Saharan Africa's $1.4 trillion is about two-thirds of that global total, and the region supplied more than two-thirds of the growth in 2025.
On revenue, the honest answer is a range with the definitions attached. The GSMA's own back-of-the-envelope calculation, published in its 2025 report, put revenue at "around $6 billion for the top mobile money providers" globally as of mid-2024, and noted that not all providers publish revenue data. Modelled market reports give larger numbers on broader definitions: IMARC puts the Africa mobile money market at $9.18 billion in 2025, and 6Wresearch puts it at $24.7 billion in 2024. The audited pieces support the lower end. M-PESA in Kenya earned KES 161.1 billion, about $1.25 billion, in the year to March 2025, on KES 38.29 trillion of flows, which is about 0.42% of the value moved. Airtel Money contributed more than a fifth of Airtel Africa's $4.96 billion revenue in the year to March 2025, which is more than $990 million. The e-money institutions of the West African Economic and Monetary Union earned FCFA 323.2 billion, about $550 million, in 2025. Add Orange Money, Wave, MTN's fintech business and the Nigerian operators, and the total is consistent with a revenue market in the high single-digit billions, not with $24.7 billion. This briefing's base case is therefore stated as flows of $1.4 trillion in 2025, with provider revenue in the region of $6 billion to $10 billion on the narrowest definitions and higher only on modelled definitions that count adjacent services.
The forecast range is wide for the same reason. IMARC projects its $9.18 billion to reach $67.18 billion by 2034, growth of 25.3% a year. 6Wresearch projects $47.5 billion by 2031, growth of 19.1% a year. BCG and QED, in a March 2026 report, project African fintech revenues of about $65 billion by 2030, roughly thirteen times their level. That covers all fintech, not mobile money alone. The GSMA publishes no 2030 transaction-value forecast, so this briefing does not invent one. The defensible statement is that flows grew about 23% a year in 2023 to 2025, that the revenue forecasts cluster between about $47 billion and $67 billion by the early 2030s on modelled definitions. The spread between those forecasts is itself a measure of how loosely "market size" is defined in this sector.
The scale of use is best read in accounts. Sub-Saharan Africa and North Africa together had 1.2 billion registered mobile money accounts in 2025, more than half the global total of 2.3 billion. Africa had 347 million active 30-day accounts, the most of any region and almost 60% of the global 593 million. There were 347 live mobile money services in 102 countries in 2025, with 173 of them in Sub-Saharan Africa. But the activity rate is the sobering number: monthly usage reached 25.7% of registered accounts in 2025, the highest since 2021, which still leaves almost three-quarters of accounts inactive in a given month. The GSMA itself flags fraud and transaction taxes as reasons users revert to cash. The agent network that converts cash to digital and back keeps growing: 30 million registered agents globally in 2025, up 16% on 2024, and agents cashed in $430 billion in 2025, up 20%, the fastest growth in four years.
For economic weight, the GSMA estimates that mobile money had added about $190 billion to Sub-Saharan Africa's GDP by 2023, up from $150 billion in 2022, and about $720 billion globally. The World Bank's Global Findex 2025, released in July 2025, gives the inclusion picture: 40% of adults in Sub-Saharan Africa held a mobile money account in 2024, up from 27% in 2021, the highest share of any world region, and mobile money ownership (40%) exceeded bank account ownership (38%) for the first time. Almost a quarter of adults, 23%, saved money through a mobile account in 2024, against a 9% average across low- and middle-income countries. Total financial account ownership in the region reached 58% of adults in 2024, up from 34% in 2014, and mobile money did most of the lifting.
How the Market Is Structured
Five layers make up the market, and confusing them is the most common error in writing about African mobile money. The first layer is the wallet and the rails: the account itself, held with a mobile network operator, a bank or an independent e-money issuer, and the system that moves value between accounts. The second layer is the agent network: the shops and kiosks where cash becomes digital money and back again. The third layer is the use cases: person-to-person transfers, merchant payments, bill payments, bulk disbursements such as salaries and social payments, and international remittances. The fourth layer is the adjacent financial services built on the rails: savings, micro-credit, overdrafts and insurance. The fifth layer is the infrastructure underneath: national switches, interoperable platforms and cross-border rails such as the Pan-African Payment and Settlement System.
The defining structural fact is that this market is a closed-loop business becoming an open one. The first generation of mobile money was a walled garden: money moved freely inside one operator's network and expensively or not at all outside it. That is why market shares in individual countries look like monopolies, with M-PESA at about 89% of Kenya's mobile money market and Wave at about 80% of Senegal's e-money balances. The second generation is interoperability, imposed by regulators rather than chosen by operators: Ghana's interoperability platform from 2018, Tanzania's instant payment system, Kenya's direct wallet-to-wallet transfers from February 2024, and West Africa's PI-SPI from 2025. The third generation, now arriving, is the wallet as a bank account in all but name: savings, credit and insurance sold inside the same app, and super-apps that bundle payments with shopping, transport and government services.
The second structural fact is who runs the rails. In East and Southern Africa the operators are mostly mobile network operators: Safaricom, MTN, Airtel and Vodacom. In West Africa the challenger is independent: Wave, which is not a telecom operator, took on Orange Money and MTN in Senegal and now holds about 38% of the West African Economic and Monetary Union's transaction value. In Nigeria the market is bank-led by law, and the biggest wallets belong to licensed fintechs, OPay, PalmPay and Moniepoint, not to the telecom operators. In Ethiopia the market is state-led: the state operator's Telebirr had about ten times as many users as M-PESA Ethiopia in 2025. In Egypt the market is bank-led through the central bank's own instant payment network, InstaPay, with Vodafone Cash as the largest wallet. There is no single African model, and any briefing that describes one is wrong.
The third structural fact is the gap between registration and use. Ghana had 74.1 million registered mobile money accounts in February 2025, more than double its population, but only about 24 million were active. Uganda had more than 50.5 million registered accounts at the end of 2024 and 33.7 million active ones in March 2025. Senegal had 42.6 million e-money accounts opened by the end of 2024 and 14.6 million active in the previous 90 days. Multiple SIMs and multiple wallets per person explain part of the gap, and dormancy explains the rest. The market's growth story is converting registered accounts into active ones, not adding more registrations.
The Country Map
Eight markets account for most of the continent's mobile money value and nearly all of its instructive variation. The table uses the latest published transaction value for each country, or the best proxy where the central bank does not publish a value.
| Country | Mobile money transaction value (latest) | Adults with a mobile money account, 2024 (World Bank Findex) | Defining feature |
|---|---|---|---|
| Kenya | KES 41.6tn (M-PESA only, year to Mar 2026); CBK agent flows KES 8.7tn in 2024 | 87% | The original and still the deepest market; M-PESA is 44% of Safaricom's Kenya service revenue |
| Ghana | GH¢3.02tn in 2024; GH¢4.5tn in 2025 | 78% | Fastest-growing major market; ranked first of 90 countries on the GSMA regulatory index; e-levy abolished 2025 |
| Tanzania | TZS 198.9tn in 2024 (+28.5%) | (not retrieved) | Four-way operator competition; instant payment system interoperable since 2020 |
| Uganda | UGX 326.3tn in year to June 2025 (+28.6%); UGX 365.9tn in calendar 2025 | 68% | MTN MoMo dominates; 18 licensed e-money issuers; agent network past 1 million |
| Senegal | FCFA 48,488bn in 2024 (24.1% of WAEMU total) | 67% | Wave vs Orange Money price war; Wave holds ~80% of e-money balances |
| Nigeria | NIBSS instant payments ₦1.07 quadrillion in 2024 (all digital rails) | (not retrieved) | Bank-led model; fintech wallets (OPay, PalmPay, Moniepoint) bigger than telco wallets |
| Egypt | EGP 2.4tn via InstaPay + EGP 1.8tn via wallets (to June 2025) | (not retrieved) | Central bank instant payment network; Vodafone Cash dominates wallets |
| Ethiopia | Telebirr ETB 4.93tn cumulative since 2021; 7.6bn ETB/day | (not retrieved) | State operator dominates; M-PESA the challenger with 5.2m users and tiny revenue |
Kenya is the market every other country is measured against, and it is still growing. M-PESA processed 46.2 billion transactions worth KES 41.6 trillion in the year to March 2026, up from 37.15 billion transactions worth KES 38.29 trillion the year before, and reached 40 million monthly active users in March 2026, its 19th birthday. M-PESA revenue was KES 161.1 billion in the year to March 2025, 44.2% of Safaricom's Kenya service revenue, and its processing capacity rose from 4,500 to 6,000 transactions a second in the year to March 2026. The central bank's narrower series, which counts agent cash-in and cash-out only, put 2024 flows at KES 8.7 trillion, more than half of GDP. The number of active agents reached 381,116 in December 2024. Competition is finally moving: M-PESA's market share slipped from 92.3% in September 2024 to 89% in December 2025 as Airtel Money gained from direct wallet-to-wallet transfers, which the central bank enabled in February 2024. Kenya's unfinished business is the central switch: the central bank announced a Fast Payment System in October 2024, and a draft National Payment System Policy in August 2026 proposes a national instant payment switch, but no launch date had been confirmed by October 2026.
Ghana is the fastest-growing major market in this briefing. Transaction value reached GH¢3.02 trillion in 2024, up 57.9% on 2023, on 8.1 billion transactions. The Bank of Ghana's data put the 2025 full-year total at GH¢4.5 trillion, a further rise of about 49%. Registered accounts reached 73 million at the end of 2024 and 74.1 million by February 2025, with about 24 million active, and registered agents reached 896,000, of whom 411,000 were active. Ghana's rise was built on interoperability, launched in 2018, which let money move between wallets, banks and the national switch. The GSMA ranked Ghana first of 90 countries on its 2024 Mobile Money Regulatory Index with a score of 95.06. The defining policy event was the abolition of the 1% electronic transfer levy on 2 April 2025, after three years in which the levy had discouraged digital transactions. The next test came in May 2026, when MTN announced a 0.75% fee on wallet-to-bank transfers and the Bank of Ghana ordered it paused pending consultation.
Tanzania is the most competitive operator market in East Africa. Mobile money transactions reached TZS 198.9 trillion in 2024, up 28.5%, on 6.6 billion transactions, according to the Bank of Tanzania's Financial Stability Report, and active accounts reached 63.2 million in December 2024. Four operators share the market: M-Pesa led with 24 million subscribers in December 2024, followed by Mixx by Yas with 19 million, Airtel Money with 11 million and HaloPesa with 5 million, and by December 2025 M-Pesa's share was 41.2% of 76.5 million accounts. Tanzania's interoperability runs through the Tanzania Instant Payment System, which processed TZS 29.9 trillion in 2024, nearly double the year before. The tax burden is the friction: the government has layered excise duty, VAT on service charges and an electronic transaction levy on digital finance, and by 2023 digital finance taxes were about 2.71% of government revenue.
Uganda runs on MTN MoMo, with Airtel Money second and a long tail of licensed issuers behind them. Electronic money transactions reached UGX 326.3 trillion in the year to June 2025, up 28.6%, on 8.4 billion transactions, according to the Bank of Uganda, and the calendar-2025 total was UGX 365.9 trillion. MTN MoMo Uganda alone processed more than $36 billion, about UGX 140.8 trillion, in annual transactions, connecting more than 13 million monthly active users to a network of 200,000 agents. Registered accounts passed 50.5 million at the end of 2024, active accounts reached 33.7 million in March 2025, and agents numbered 1,016,914 in June 2025, up 27% in a year. The regulator licensed 18 e-money issuers by June 2025, and the structural event of the year was MTN Uganda shareholders approving the separation of MTN Mobile Money into a standalone company in July 2025. The tax overhang is real: the revenue authority served MTN Uganda a UGX 260 billion tax demand in 2024 covering excise duty and VAT.
Senegal is where the price war was fought and won by an outsider. E-money accounts carried 2.87 billion transactions worth FCFA 48,488 billion in 2024, the largest total of any country in the West African Economic and Monetary Union and 24.1% of the union's total, according to the BCEAO. Wave, founded in Dakar in 2018, reported nearly 11 million active customers in Senegal in February 2025, and by the end of 2025 it held about 80.6% of the country's outstanding e-money balances, FCFA 459.9 billion of FCFA 571 billion, against Orange Money's 18.6%. Across the union, Wave's share of transaction value rose from 34.0% in 2023 to 38.2% in 2024, behind Orange Money's 41.3% and ahead of MTN MoMo's 11.7%. Senegal's account ownership reached 76.5% of adults in 2024, up from 56.0% in 2021, on World Bank figures. The cost of that success is now visible in regulation: a 0.5% government tax on money transfers took effect in December 2025.
Nigeria is the exception that proves the rule that mobile money needs a licence model that fits the country. The Central Bank of Nigeria kept telecom operators out of mobile money for years, then licensed payment service banks in 2022. The market that grew in the meantime belongs to fintechs. OPay says it serves more than 50 million users, with 39.3 million monthly active users at the end of 2025. PalmPay reports more than 35 million registered users and about 15 million daily transactions. Moniepoint reports more than 20 million customers, more than 1 billion transactions a month and more than $22 billion in monthly payment volume. The rails underneath them are formidable: the Nigeria Inter-Bank Settlement System's instant payment rail processed 11.2 billion transactions worth ₦1.07 quadrillion in 2024. The telecom wallets are catching up from a low base: Airtel's SmartCash had 1.7 million active customers in March 2025. MTN's MoMo payment service bank is the group's designated growth bet in its largest market. The regulator's grip tightened in April 2024, when the central bank ordered OPay, PalmPay, Moniepoint and Kuda to pause new customer onboarding over know-your-customer gaps. Onboarding resumed after remediation.
Egypt is the North African model: a central bank instant payment network, not a telecom wallet, doing the work. InstaPay, built on the Central Bank of Egypt's Instant Payment Network and launched in March 2022, passed 16 million users by June 2025, with more than 1.1 billion transactions worth EGP 2.4 trillion. Mobile wallets reached 55.5 million by June 2025, carrying 1.4 billion transactions worth more than EGP 1.8 trillion. Vodafone Cash dominates them with more than half of wallets, 78% of transactions and 81% of transaction value. Financial inclusion reached 76.3% of adults by June 2025. InstaPay introduced a 0.1% fee on transfers in April 2025, capped at EGP 20 per transfer, after three years free. Usage kept growing: by September 2026 InstaPay had passed 24 million users and EGP 7 trillion in transactions, and wallets had reached 67 million.
Ethiopia is the state-led counter-model. Telebirr, the mobile money arm of state-owned Ethio Telecom, launched in May 2021 and had 52.56 million customers by April 2025, with ETB 4.93 trillion in cumulative transactions, about $30.7 billion, moving ETB 7.6 billion a day through 320,000 agents and 310,000 merchants. By the end of 2025 Telebirr counted 58.61 million subscriptions. M-PESA Ethiopia, licensed in May 2023 and launched that August, had 5.2 million active users in the year to March 2026, processing 442.2 million transactions worth about $221.4 million, but revenue of only about $77,000, 0.071% of Safaricom Ethiopia's service revenue. Integration with the national switch EthSwitch in October 2025 accelerated adoption, but in December 2025 Ethio Telecom blocked access to M-PESA's telco-agnostic Lehulum app from its network, locking out about 90% of Ethiopia's mobile users. The World Bank's October 2025 telecom market assessment flagged Ethio Telecom's significant market power. Ethiopia is the test of whether a state incumbent can be outcompeted, and so far the answer is no.
The Value Chain
The value chain starts with cash and ends with a digital balance, and the money is made in the middle. A customer hands cash to an agent, who credits the wallet. That cash-in is the most expensive step in the chain, because the agent must be paid and the cash must be moved and secured. The customer then sends money, pays a merchant or a bill, or saves it, and each of those steps is cheap to process but only earns a fee if the provider charges for it. The final step is cash-out, when the recipient withdraws physical money, and that is where the second agent commission is paid. The economics of the whole chain are therefore the economics of the agent network: whoever controls the agents controls the market, which is why Wave built its own 150,000-agent network rather than renting the telecom operators', and why MTN rationalised its active agents down to 1.2 million in 2024 to improve quality over quantity.
Once the money is digital, the value shifts up the chain. Person-to-person transfers are still the largest use case by value, about six times merchant payments on GSMA figures, but merchant payments are the fastest-growing: more than $100 billion was transacted in merchant payments in Sub-Saharan Africa in 2024, with East Africa at $48 billion, up 41% in a year, driven mostly by Kenya, and about half a billion merchant payments processed every month. Bulk disbursements, salaries, social payments and aid, were worth $97 billion globally in 2024. International remittances into wallets are the smallest of the big use cases by value but the most contested, because the cost of sending $200 to Sub-Saharan Africa averaged 8.46% in the third quarter of 2025, the highest of any region in the world, and mobile money is the cheapest way to receive it.
Above the payments layer sits the financial services layer, and that is where the margins are. By June 2024, 44% of mobile money providers offered credit, making it the most widely offered adjacent service, with savings close behind and insurance offered by about 28%. M-PESA's Fuliza overdraft in Kenya disbursed KES 1.1 trillion in the year to March 2025, and its wealth management products held KES 9.6 billion with 631,000 active customers. Telebirr disbursed ETB 13.22 billion in micro-loans to 6.88 million users and mobilised ETB 11.24 billion in digital savings. Orange Money and JUMO signed a multi-year micro-lending partnership in July 2025, starting in Burkina Faso, to offer $5 to $500 loans from wallet balances. The World Bank's Findex 2025 found that nearly six in ten formal borrowers in Sub-Saharan Africa now borrow through a mobile money account. The wallet is becoming the bank, and the bank is becoming the rails underneath it.
The binding constraints sit at the two ends of the chain. At the cash end, the constraint is the agent: agents need liquidity, security and a commission that makes the business worth running, and rural agents are the thinnest part of every network. At the digital end, the constraint is interoperability: money that cannot leave its home network is worth less than money that can, and every closed loop is a tax on the user. Between them sits the foreign exchange constraint: most mobile money value is domestic, but the cross-border corridors that matter for trade and remittances still run on correspondent banking and cash agents. The Pan-African Payment and Settlement System, launched in January 2022, is only beginning to connect wallets across borders.
Key Players by Country
The tables below list the players that actually operate in each market, with what they do there and a link to the company's official website. Only official sites are linked. Where a website returned a bot-block or could not be reached from this machine on 20 November 2026, the link is still the company's official domain. No player is listed without a verifiable fact attached.
Kenya
| Player | What it does in Kenya | Position | Official website |
|---|---|---|---|
| Safaricom / M-PESA | Mobile money: transfers, merchant payments, savings, credit, insurance; agent network | 40m monthly active users (Mar 2026); ~89% market share (Dec 2025); revenue KES 161.1bn FY25 | www.safaricom.co.ke |
| Airtel Money (Airtel Africa) | Mobile money on the Airtel network; transfers, merchant payments | 7.6% market share (Sep 2024), gaining after direct wallet transfers enabled Feb 2024 | airtel.africa |
| Equity Bank (Equitel) | Bank-led mobile money and agency banking; Equitel thin SIM | One of Kenya's largest banks; mobile banking arm with agency network | equitygroupholdings.com |
| KCB Bank (KCB Mobi) | Bank-led mobile and agency banking | Kenya's largest bank by assets; agency banking network | kcbgroup.com |
Ghana
| Player | What it does in Ghana | Position | Official website |
|---|---|---|---|
| MTN Mobile Money (MTN Ghana) | Mobile money: transfers, merchant payments, savings, insurance; largest wallet | Largest wallet in Ghana; part of MTN Group's $500.3bn group transaction value in 2025 | www.mtn.com.gh |
| AirtelTigo Money | Mobile money on the AirtelTigo network | Third operator wallet; smaller share behind MTN and Vodafone | www.airteltigo.com.gh |
| Telecel Cash (ex-Vodafone Cash) | Mobile money on the Telecel (ex-Vodafone) network | Second operator wallet in Ghana | www.telecel.com.gh |
| GCB Bank (G-Money) | Bank-led mobile money wallet | State-owned bank's wallet, interoperable via GhIPSS | www.gcbbank.com.gh |
Tanzania
| Player | What it does in Tanzania | Position | Official website |
|---|---|---|---|
| Vodacom / M-Pesa | Mobile money: transfers, merchant payments, savings, credit | 24m subscribers Dec 2024; 41.2% share Dec 2025; largest wallet | www.vodacom.co.tz |
| Mixx by Yas (ex-Tigo Pesa) | Mobile money on the Yas network | 19m subscribers Dec 2024; second wallet | www.yas.co.tz |
| Airtel Money (Airtel Africa) | Mobile money on the Airtel network | 11m subscribers Dec 2024; third wallet | airtel.africa |
| HaloPesa (Halotel) | Mobile money on the Halotel network | 5m subscribers Dec 2024; fourth wallet | www.halotel.co.tz |
Uganda
| Player | What it does in Uganda | Position | Official website |
|---|---|---|---|
| MTN Mobile Money (U) Ltd | Mobile money: transfers, merchant payments, savings, loans | more than $36bn (UGX 140.8tn) in annual transactions; 13m+ monthly active users; separated as standalone company July 2025 | www.mtn.co.ug |
| Airtel Mobile Commerce (U) Ltd | Mobile money on the Airtel network | Second wallet; part of Airtel Africa's $136bn FY25 transaction value | airtel.africa |
| Wave Transfer Ltd | Mobile money (Wave's Uganda operation) | Licensed e-money issuer in Uganda; part of Wave's 8-country footprint | www.wave.com |
| Stanbic Bank (Flexipay) | Bank-led e-money wallet | One of 18 licensed e-money issuers (June 2025) | www.stanbicbank.co.ug |
Senegal
| Player | What it does in Senegal | Position | Official website |
|---|---|---|---|
| Wave (Wave Digital Finance) | Mobile money: transfers at 1%, free cash-in/out, bill payments, QR cards | ~11m active customers Feb 2025; ~80.6% of e-money balances end-2025 | www.wave.com |
| Orange Money (Sonatel) | Mobile money via Max it app and USSD; transfers, merchant and bill payments | ~18.6% of e-money balances end-2025; 41.3% of WAEMU value with Wave at 38.2% | www.orange.com |
| Free Money (Free Senegal) | Mobile money on the Free network | Third wallet in Senegal; licensed e-money issuer | www.free.sn |
| E-Money Senegal (Expresso) | Mobile money on the Expresso network | Smaller operator wallet; licensed e-money issuer | www.expressotelecom.sn |
Nigeria
| Player | What it does in Nigeria | Position | Official website |
|---|---|---|---|
| OPay | Licensed mobile money operator; wallet, transfers, savings, loans, 500k+ agents | 50m+ users; 39.3m monthly active users end-2025 | opayweb.com |
| PalmPay | Licensed mobile money operator; wallet, transfers, merchant payments | 35m+ registered users; ~15m daily transactions | www.palmpay.com |
| Moniepoint | Microfinance bank + mobile money; agent network and POS, business banking | 20m+ customers; 1bn+ transactions/month; $22bn+ monthly volume | moniepoint.com |
| MTN MoMo PSB | Payment service bank; mobile money wallets on the MTN network | Licensed 2022; MTN Group's designated growth bet in its largest market | www.mtn.com |
| Airtel SmartCash PSB | Payment service bank; mobile money wallets on the Airtel network | 1.7m active customers Mar 2025 | airtel.africa |
| Paga | Licensed mobile money operator; wallet, transfers, merchant payments | 17m+ users | www.paga.com |
Egypt
| Player | What it does in Egypt | Position | Official website |
|---|---|---|---|
| Vodafone Cash | Mobile wallet; transfers, merchant and bill payments | >50% of wallets; 78% of transactions; 81% of transaction value | www.vodafone.com.eg |
| InstaPay (Central Bank of Egypt) | Instant payment app on the national Instant Payment Network | 16m+ users, EGP 2.4tn by June 2025; 24m users by Sep 2026 | www.instapay.eg |
| Orange Cash | Mobile wallet on the Orange Egypt network | One of the licensed wallet operators in Egypt | www.orange.com |
| Etisalat Cash (e& Egypt) | Mobile wallet on the e& network | One of the licensed wallet operators in Egypt | www.etisalat.eg |
Ethiopia
| Player | What it does in Ethiopia | Position | Official website |
|---|---|---|---|
| Telebirr (Ethio Telecom) | Mobile money: transfers, merchant payments, micro-credit (Mela), savings (Sanduq), overdraft (Endekise) | 52.56m customers Apr 2025; 58.61m subscriptions end-2025; state operator | www.ethiotelecom.et/telebirr |
| M-PESA Ethiopia (Safaricom Ethiopia) | Mobile money: transfers, merchant payments, wallet-to-bank via EthSwitch | 5.2m active users FY26; 442.2m transactions worth ~$221.4m | www.safaricom.co.ke |
| Commercial Bank of Ethiopia (CBE Birr) | Bank-led mobile money wallet | State bank's wallet; interoperable via EthSwitch | www.combanketh.et |
Regulation and Policy
Mobile money is regulated country by country, and the regulators are mostly central banks, not telecom regulators. Kenya's Central Bank of Kenya licenses payment service providers under the National Payment System Act of 2011, with e-money issuers required to hold customer funds in trust accounts at commercial banks. Ghana's Bank of Ghana licenses e-money issuers under the Payment Systems and Services Act of 2019 and runs the interoperability switch through the Ghana Interbank Payment and Settlement Systems. Nigeria's Central Bank of Nigeria licenses mobile money operators and payment service banks under separate frameworks, and kept telecom operators out of wallets until the payment service bank licences of 2022. Uganda's Bank of Uganda licenses e-money issuers under the National Payment Systems Act of 2020. Tanzania's Bank of Tanzania licenses payment system providers under the National Payment System Act of 2015. West Africa's eight-country WAEMU zone is regulated by the BCEAO, the regional central bank, which licenses e-money institutions across the union. Egypt's Central Bank of Egypt runs the Instant Payment Network itself and licenses the wallets that sit on it. Ethiopia's National Bank of Ethiopia licensed M-PESA in May 2023, two years after Telebirr launched, and the state operator's dominance is a policy choice as much as a market outcome.
What changed in the last 24 months is mostly about interoperability and taxation, and the two pull in opposite directions. On interoperability, Ghana's model is the reference: full wallet-to-wallet, wallet-to-bank and bank-to-wallet movement since 2018, which the Bank of Ghana credits with the growth from GH¢223 billion in annual transactions in 2018 to GH¢4.5 trillion in 2025. Kenya followed in February 2024, when the central bank and the industry removed the withdrawal codes that had forced M-PESA to Airtel Money transfers to go through a voucher, and direct wallet-to-wallet transfers began. West Africa went furthest: the BCEAO launched its instant payment platform, PI-SPI, on 30 September 2025, and from 2 November 2026 all interoperable e-money transfers across the eight WAEMU countries must route through it, with transfers under 8,000 CFA francs a day free and larger transfers capped at 0.8%. The launch was rocky, with failed transfers and alias clashes reported in the first days. Wave responded to the fee cap by introducing a 1% cash-out fee, which the cap does not cover. Kenya's central bank announced its own Fast Payment System in October 2024 and published a draft National Payment System Policy in August 2026 proposing a national instant payment switch, but no launch date had been confirmed by October 2026, and Kenya still has no central switch.
On taxation, the direction is mixed. Ghana abolished its 1% electronic transfer levy on 2 April 2025, after three years in which the levy had pushed some users back to cash. Senegal imposed a 0.5% government tax on money transfers in December 2025. Uganda's 0.5% levy on withdrawals, introduced in 2018 and repeatedly revised, remains a drag on usage. Tanzania layers excise duty, VAT on service charges and an electronic transaction levy on digital finance. Kenya charges 12% excise duty on the fees cellular providers charge for money transfers. The GSMA's 2026 report states the consequence plainly: transaction taxes encourage users to revert to cash in the countries where they are in effect, and that reverses financial inclusion. The same report notes that more than 60% of providers say interoperability, know-your-customer and consumer protection rules have supported their operations, while 24% say cross-border data transfer rules have hindered them.
Two structural regulatory events deserve attention. The first is the separation of fintech from telecoms: MTN Uganda shareholders approved the structural separation of MTN Mobile Money into a standalone company in July 2025, MTN Ghana shareholders approved a merger of its two mobile money entities in December 2025. MTN signed definitive agreements with Mastercard in the first quarter of 2024 for a minority investment in its group fintech structure, announced in August 2023 at $200 million. Airtel Africa plans to list Airtel Money in the first half of 2026. The second is the arrival of the super-app and the platform rules that follow it: MTN partnered with Ant International in June 2026 to turn MoMo into a super-app ecosystem, Orange's Max it super-app reached 38.5 million active users by the third quarter of 2026. Telebirr's SuperApp bundles payments with social features and mini-apps. Regulators have not yet decided whether a super-app is a telecom service, a bank or a marketplace, and that ambiguity is itself a risk.
Demand: Who Buys, and Who Pays
The buyers are, overwhelmingly, people the formal banking system never served. The World Bank's Findex 2025 found that for a third of adults with a formal account in Sub-Saharan Africa, mobile money is the only financial account they have. The core use is still person-to-person transfers: money sent home by urban workers, traders settling with suppliers, families supporting relatives. Merchant payments are the growth use case, and bill payments, school fees, utility payments and government disbursements are the ones that make the wallet a daily habit rather than a monthly one. Savings is the use case with the deepest welfare effect: 23% of adults in Sub-Saharan Africa saved through a mobile account in 2024. The share is higher in the countries where wallets are oldest, Kenya, Ghana, Senegal, Uganda and Zambia, where nearly half of adults use the service to save.
Who pays depends on the use case. In person-to-person transfers, the sender pays, and the fee is usually a percentage of the amount or a tiered flat fee. In merchant payments, the merchant often pays, or the fee is split. The fastest-growing merchant segment is the informal trader, the market stall and the boda-boda rider, for whom the wallet replaces cash handling and the risk of theft. In bulk disbursements, the payer is a government, an employer or an aid agency, and the wallet is the cheapest distribution channel they have. In remittances, the sender abroad pays, and the cost is the highest in the world for this region: 8.46% on a $200 transfer to Sub-Saharan Africa in the third quarter of 2025, against a global average of 6.36%, and a Sustainable Development Goal target of 3%. Banks charge the most, 14.99% on average, and mobile operators the least among the traditional channels at 4.97%, which is why wallet-to-wallet remittance corridors are the most promising price competition in the market.
Affordability is the constraint that decides whether demand converts into use. The Central Bank of Kenya's target is to cut the average cost of a mobile money transaction from about KES 23 to KES 10 by 2028. Wave's flat 1% fee in Senegal, against the 5% to 10% the incumbents charged when it launched, is the clearest evidence that price is the decisive variable: it won about 80% of Senegal's e-money balances in seven years on price alone. But price is not the only cost: the tax on the transaction, the cost of cashing out, the cost of the phone and the data, and the cost of a failed transaction that must be chased, all sit on top of the fee. Where those costs stack up, as they do in Tanzania and Uganda, usage stays shallow even where registration is high.
Supply: Local vs Imported
Mobile money is the most locally produced financial service in Africa, and that is the point of it. The wallets are built and run by African operators and fintechs, the agents are local shopkeepers, and the value stays in the domestic payment system. There is almost no import dependence in the core service: the software is licensed or built in-house, the USSD and app channels run on local networks, and the trust accounts sit in local banks. The imported inputs are the handsets, the network equipment and the cloud infrastructure, and the foreign capital behind some of the operators, but none of those decides whether a wallet works in a village.
The supply constraint is not imports but distribution and liquidity. Agents must hold enough electronic float and enough physical cash to meet demand in both directions, and in rural areas the cash has to be physically moved, which is expensive and sometimes dangerous. That is why agent numbers matter as much as account numbers: Ghana had 896,000 registered agents in February 2025, Uganda passed 1 million in June 2025, Kenya had 381,116 active agents in December 2024, and Telebirr had 320,000 agents in Ethiopia. The second constraint is the network itself: USSD, the channel most users still rely on, depends on the mobile network working, and in conflict-affected markets such as Sudan and the eastern Democratic Republic of Congo, network outages cut people off from their money. The third constraint is the human one: agents need training, fraud awareness and a commission structure that keeps them in business. The GSMA's 2026 report notes that active agent growth is concentrated in East Africa, which supplied 53% of it in 2025.
The exception to local supply is the cross-border layer. International remittances into wallets depend on money transfer operators, correspondent banks and, increasingly, fintechs such as Onafriq, which connects wallets across more than 40 countries. The regional switches are PAPSS for Africa and PI-SPI for West Africa. The value that crosses borders is still a small share of the $1.4 trillion. The corridors are still expensive, but they are where the next supply-side investment is going, because they are where the margin is.
Prices & Economics
Four price points anchor this market, and they tell the whole story. The first is Wave's flat 1% fee on transfers in Senegal and Cote d'Ivoire, with deposits, withdrawals and bill payments free. When Wave launched in Senegal in 2018, the incumbents charged 5% to 10% per transaction. Wave's price cut the cost of sending money by roughly four-fifths and forced Orange Money to cut its transfer fee to 0.8% in 2021. The second is InstaPay's 0.1% fee in Egypt, capped at EGP 20 per transfer, introduced in April 2025 after three years of free transfers, with usage still growing. The third is the cost of sending $200 home to Sub-Saharan Africa: 8.46% on average in the third quarter of 2025, or $16.92, against a global average of 6.36% and a Sustainable Development Goal target of 3%. Banks charge 14.99% on that corridor, money transfer operators 4.72% and mobile operators 4.97%, which is why the wallet is the cheapest way to receive money from abroad and the most expensive way to send it through a bank. The fourth is the average cost of a mobile money transaction in Kenya, about KES 23, which the central bank aims to cut to KES 10 by 2028 through fee caps and the new fast payment system.
The margin structure follows the fee. M-PESA Kenya earned KES 161.1 billion on KES 38.29 trillion of flows in the year to March 2025, about 0.42% of the value moved. Safaricom's own take rate on chargeable transactions was 0.62%, the difference being the large volume of free and low-value transactions. Five years ago withdrawal fees were 38% of M-PESA's revenue. By the year to March 2025 they were 23%, and business payments were the biggest contributor to revenue growth for the second year running. The business is shifting from taxing cash-out to charging businesses for payments, credit and services, which is a healthier margin and a harder one to defend against competitors. The WAEMU e-money institutions earned FCFA 323.2 billion in 2025 on balances of FCFA 1,923.2 billion, and their net profit rose from FCFA 6.1 billion to FCFA 16.9 billion in a year, which suggests the model is becoming profitable at scale rather than merely large.
For the user, the price that matters most is the total cost of a transaction, not the headline fee. A transfer that costs 1% but requires a 5% cash-out fee at the other end, a bus fare to the nearest agent and a day of waiting for a failed transaction to reverse, is not a 1% transfer. That is why the cheapest markets in this briefing, Senegal and Egypt, are the ones where the whole journey is cheap, and why the most expensive, the remittance corridors into Southern Africa, stay expensive even as the technology gets cheaper: the cost sits in the foreign exchange margin, the correspondent banking chain and the cash-out at the end, not in the wallet.
Investment Landscape
Investment in African mobile money has moved from venture capital into infrastructure finance, and the deals of the last two years show the shift.
| Deal / event | Date | Amount / detail | Why it matters |
|---|---|---|---|
| Wave Series A | Sep 2021 | $200m; $1.7bn valuation (Founders Fund, Sequoia Heritage, Ribbit Capital, Stripe) | First francophone African unicorn; proved an independent wallet could beat telecom incumbents on price |
| Wave debt financing | June 2025 | EUR 117m (~$137m); Rand Merchant Bank lead; BII, Finnfund, Norfund | 100% debt, not equity; DFIs funding working capital and expansion into 8 markets |
| Mastercard / MTN Group Fintech | Announced Aug 2023; definitive agreements Q1 2024 | $200m minority investment in MTN's fintech structure | Validates fintech spin-off model; MTN Uganda separation approved July 2025 |
| Airtel Money minority stakes + IPO plan | 2021 stakes; IPO announced May 2025 | TPG $200m + Mastercard $100m (2021); listing planned H1 2026 | Airtel Money to be listed separately; 44.6m customers, $136bn transaction value FY25 |
| Orange + JUMO micro-lending | July 2025 | Multi-year partnership; rollout from Burkina Faso | Credit embedded in Orange Money; JUMO has issued $8bn+ in loans to 31m customers |
| MTN + Ant International | June 2026 | Partnership to build MoMo into a super-app ecosystem | Platform play: payments plus e-commerce, lending and services on one app |
| M-KOPA debt + equity | 2023 | $250m | PAYGo smartphone and solar financing repaid through mobile money; adjacent credit model |
| Wave DRC licence | Nov 2026 | Licence granted after 11-year freeze on new entrants | Wave enters Central Africa's largest market; expansion to 11 countries claimed |
The active investors are development finance institutions, the card networks and the telecom groups themselves. The DFIs, BII, Finnfund, Norfund, the IFC and Proparco, fund the independent challengers and the working capital behind agent networks. Mastercard has taken minority stakes in both MTN's and Airtel's fintech arms, which is a bet that the wallets become the rails for everything else. The telecom groups are spinning the fintech units out, MTN Uganda in July 2025, MTN Ghana's merger in December 2025, Airtel Money's planned listing in the first half of 2026, because a standalone fintech is worth more than a division inside a telecom operator and because regulators increasingly want the money business separated from the network business. Private equity and venture capital, which funded the first wave of wallets, have largely moved on to the adjacent layers: credit, savings, insurance and cross-border rails, where the margins are higher and the competition thinner.
Challenges and Risks
The risks are specific, and they are ranked by how much damage they do to the market's core promise, which is that money in a wallet is as good as cash, only safer and cheaper.
First, fraud. The GSMA's 2026 report names fraud as widespread and a reason users revert to cash. The fraud takes every form the market's growth creates: SIM swaps, agent fraud, fake reversals, phishing on the back of a trusted brand. The Bank of Ghana has built a financial intelligence platform to track cyber threats across the industry, and still reports fraud losses as a serious and likely underreported problem. Every fraud story that reaches the news costs the market more than the money stolen, because it costs trust.
Second, taxation. Transaction taxes push users back to cash, and governments keep imposing them because mobile money is visible, measurable and easy to tax. Ghana's e-levy cost the market three years of slower growth before it was abolished in 2025. Uganda's levy and Tanzania's layered taxes have the same effect. Senegal's new 0.5% transfer tax, imposed in December 2025, will be the next test of whether a government can tax the rails without breaking them.
Third, dormancy. Three-quarters of registered accounts are inactive in a given month, and the gap between registration and use is the market's largest inefficiency. Ghana has 74 million registered accounts and about 24 million active ones. Uganda has more than 50 million registered and 33.7 million active. The accounts exist because registration is cheap and often automatic. The usage does not follow because the use cases, the prices and the trust are not yet there for everyone who holds an account.
Fourth, concentration. The markets in this briefing are dominated by one or two players each: M-PESA at about 89% in Kenya, Wave at about 80% of Senegal's balances, Telebirr at about ten times M-PESA Ethiopia's user base, MTN MoMo in Uganda. Dominance brings stability and network effects, and it also brings the risk that a single point of failure becomes a systemic one: Kenya's central bank warned in 2026 that if M-PESA failed, the country's financial system could wobble, and M-PESA now holds about KES 250 billion in customer funds in trust accounts at commercial banks, tying the platform's stability to the banking system's liquidity.
Fifth, interoperability that arrives late or broken. Kenya still has no central switch, two years after the central bank announced one. West Africa's PI-SPI launched with failed transfers and alias clashes in November 2026. The fee cap that was supposed to make transfers cheaper pushed Wave to introduce a cash-out fee the cap does not cover. Interoperability imposed by regulators works when the technology and the incentives line up, and fails when they do not.
Sixth, currency and the reporting illusion. The naira's devaluation cut Airtel Africa's reported revenue by 0.5% in the year to March 2025 even as it grew 21.1% in constant currency, and cut MTN's reported service revenue by 15.4% in 2024 even as it grew 13.8% in constant currency. Dollar figures for African mobile money flatter or understate the underlying growth depending on the exchange rate, and any briefing that reports only one currency is misleading.
Seventh, the gender gap. The GSMA's 2026 report found a wide gender gap in mobile money account ownership in seven of ten countries surveyed, and outside Ghana, Kenya and Nigeria, women who own an account are still less likely than men to have used it in the past month. A market that does not reach women does not reach the household, and the gap is a demand risk as much as an inclusion failure.
Opportunities & White Spaces
The gaps the data reveals are the opportunities, and they are not the generic ones. Merchant payments are the clearest: more than $100 billion moved through merchant payments in Sub-Saharan Africa in 2024, East Africa grew 41% in a year, and person-to-person transfers are still six times larger, which means the merchant opportunity is mostly still ahead. The informal trader who takes payments on a wallet, the market stall that settles suppliers by phone, the boda-boda rider who is paid through an app, are the customers the next growth will come from. They are the customers the banks never reached.
Credit is the second gap. Nearly six in ten formal borrowers in Sub-Saharan Africa now borrow through a mobile money account, but the loans are small, short and expensive. The credit scoring is still mostly based on airtime and transaction history. The operator that can price risk better, using wallet data plus the new national digital ID systems such as Ethiopia's Fayda, which has issued more than 30 million IDs, can lend more cheaply and to more people. Orange and JUMO's partnership, M-PESA's Fuliza and Telebirr's Mela are the first attempts, not the last.
Cross-border payments are the third gap, and the most valuable. Sending $200 to Sub-Saharan Africa costs 8.46% on average, and the corridors inside Africa are often more expensive than the corridors from Europe or the Gulf. The wallets that connect to each other across borders, through PAPSS, through PI-SPI, through bilateral links such as the ones Onafriq operates, can take that margin. The prize is not the fee on a remittance but the trade payment: the small trader in Kampala paying a supplier in Nairobi, the farmer in Tamale buying seed from Abidjan.
The fourth gap is the one the regulators are creating. Interoperability mandates, PI-SPI in West Africa, the coming fast payment system in Kenya, Tanzania's instant payment system, are opening closed loops. The first movers on the open rails will be the ones who built for them. The fifth gap is the Democratic Republic of Congo, where Wave won a licence in November 2026 after an eleven-year freeze on new entrants, and where more than 100 million people have almost no mobile money at all. The sixth gap is savings and insurance for the informal majority: 23% of adults already save through a mobile account. The provider that turns that saving into an interest-bearing, insured product at scale will own the next decade of this market.
Outlook to 2030
The base case is that the flows keep growing at double-digit rates and the revenue follows more slowly, because prices keep falling. Transaction value in Sub-Saharan Africa grew about 23% a year in 2023 to 2025, from $919 billion to $1.4 trillion, and there is no sign of the growth stopping: East Africa grew 24% in 2025, West Africa grew about 40%, and the agent network grew 16%. If flows grew at even half that rate for five more years, they would pass $2.5 trillion by 2030. This briefing does not publish that as a forecast, because the GSMA publishes no 2030 figure and the growth rate depends on taxes, fraud and interoperability decisions that have not been made yet. The credible anchors are the ones already published: BCG and QED's projection of about $65 billion in African fintech revenues by 2030. The modelled mobile money revenue forecasts of about $47 billion by 2031 and $67 billion by 2034, both of which should be read as the top of a wide range on modelled definitions.
Three swing factors decide the outcome. The first is interoperability: if Kenya's fast payment system launches and West Africa's PI-SPI stabilises, closed loops open, prices fall and volumes rise. The market grows faster than the base case. If they stall, the dominant players keep their walled gardens and growth slows. The second is taxation: if more governments follow Ghana and abolish transaction taxes, usage deepens. If more follow Senegal and impose them, users go back to cash and the growth rate halves. The third is credit: if wallets become the main channel for small loans, savings and insurance, revenue per user rises sharply and the market becomes a financial system rather than a payments system. If credit stays small and expensive, the wallets stay pipes and the revenue stays thin.
The most likely picture by 2030 is a continent where the wallet is the account for most adults, where merchant payments rival person-to-person transfers, where the largest wallets are listed separately from their telecom parents, and where the price of moving money inside Africa has fallen by half or more. The least likely picture is the one in which the market stalls: the demand is too deep, the infrastructure too built and the alternatives too expensive for that. The risk is not that mobile money stops growing, but that it grows in the wrong direction, towards concentration, taxation and fraud, instead of towards openness, affordability and trust.
FAQ
How big is the mobile money market in Africa? More than $1.4 trillion flowed through mobile money wallets in Sub-Saharan Africa in 2025, about two-thirds of the global total of more than $2 trillion, according to the GSMA. That is the value of the money moved, not the revenue earned: providers earn fees on those flows. The GSMA estimates revenue at about $6 billion for the top providers globally, while modelled reports range up to about $25 billion for Africa depending on definition.
Which country has the biggest mobile money market in Africa? Kenya, by depth and by the size of its largest wallet: M-PESA alone moved about KES 41.6 trillion, roughly $320 billion, in the year to March 2026, with 40 million monthly active users. Ghana is the fastest-growing major market, with transaction value up 57.9% in 2024 and a further 49% in 2025. By region, East Africa processed $806 billion in 2025, ahead of West Africa's $498 billion.
Who are the biggest mobile money providers in Africa? The five largest are Safaricom's M-PESA in Kenya, MTN MoMo with 69.5 million monthly active users and $500.3 billion in transaction value in 2025, Airtel Money with 44.6 million customers and $136 billion in transaction value in the year to March 2025, Orange Money with 44 million active users, and Wave, the independent challenger with more than 20 million monthly users in West Africa. In Nigeria the biggest wallets belong to fintechs: OPay, PalmPay and Moniepoint.
Why is mobile money so big in Africa and so small elsewhere? Because Africa skipped the bank branch and the card. Mobile money launched in 2007 in Kenya, where most people had a phone and no bank account, and it solved the problem of moving cash safely over distance. The same need did not exist in markets where everyone already had a bank account and a card. Regulation helped: central banks licensed e-money issuers and, in Ghana and West Africa, mandated interoperability, while the agent network solved the last mile that banks never reached.
Is mobile money safe? Safer than cash in most respects, and not safe in all of them. Customer funds are held in trust accounts at commercial banks in most markets, which protects them if the provider fails, and the wallet leaves a record that cash does not. But fraud is widespread, according to the GSMA, SIM swaps and agent fraud are common, and a wallet is only as safe as the phone, the PIN and the agent network around it. The practical advice is the same as for a bank account: keep the PIN secret, use the official app, and cash out through a registered agent.
Data Sources & Methodology
Definitions. Transaction value is the total value of money moved through mobile money wallets in a year: transfers, merchant payments, bill payments, bulk disbursements, cash-in and cash-out. It is not revenue, and it is not GDP. Provider revenue is the fees and commissions earned on those flows. Registered accounts are all accounts ever opened. Active accounts are those used in the previous 30 days, except where a source states a 90-day window. The base case in this briefing is transaction value in Sub-Saharan Africa, because that is the figure the GSMA counts consistently and the central banks report.
Where sources disagreed. The revenue range is the largest disagreement: the GSMA's estimate of about $6 billion for the top providers globally (mid-2024) against IMARC's $9.18 billion for Africa in 2025 and 6Wresearch's $24.7 billion for Africa in 2024. The briefing shows the range and explains that the modelled reports count adjacent services and use definitions that do not reconcile with audited operator revenues. It does not publish a single revenue number. MTN's transaction value for the first nine months of 2025 was reported by one outlet at $512.5 billion, which cannot be a nine-month total when the audited full-year 2025 figure is $500.3 billion. The briefing uses the audited full-year figure and does not cite the nine-month one. M-PESA's transaction volume growth in the year to March 2026 is reported by one outlet as 28.7%. Recomputed from the published levels, 46.2 billion against 37.15 billion, it is 24.4%, and the briefing uses the recomputed figure. The Central Bank of Kenya's 2024 mobile money figure of KES 8.7 trillion covers agent cash-in and cash-out only, not all M-PESA flows, and is never compared with Safaricom's KES 38.29 trillion or KES 41.6 trillion totals. MTN MoMo Uganda's 2024 value is reported as about UGX 159 trillion by one source and as more than $36 billion, about UGX 140.8 trillion, by another. The briefing uses the second, which is tied to the same source as the user and agent counts, and uses the Bank of Uganda's national total as the country figure. Orange Money's scale is reported as about 100 million accounts in one announcement and 44 million active users in Orange's own results. The briefing uses Orange's own active-user figure. Wave's users are reported as more than 20 million monthly in July 2025 and more than 25 million in 11 countries in July 2026. The briefing uses the 2025 figure, which is sourced to a trade publication, and notes the 2026 figure is a company claim. Ghana's 2025 full-year total of GH¢4.5 trillion is reported by MyJoyOnline citing Bank of Ghana data. The January to October 2025 figure of GH¢3.6 trillion from the same source is consistent with it.
What was not used. No GSMA 2030 transaction-value forecast exists, so none is cited. The $512.5 billion MTN nine-month figure is not used. A widely repeated claim that mobile money contributed $600 billion to GDP over ten years to 2022 is a global figure and is not presented as African. No figure for the size of the mobile money market in South Africa is stated, because the market there is bank-led and small and no reliable total was found.
Vintages. GSMA figures are from the State of the Industry Report on Mobile Money 2026 (published 26 March 2026, data year 2025) unless stated as 2025 or 2024 editions. World Bank Findex figures are 2024 data, published July 2025. Central bank figures are the latest published as of November 2026: Bank of Ghana 2024 annual and 2025 monthly data, Bank of Tanzania Financial Stability Report 2024, Bank of Uganda Integrated Annual Report to June 2025, BCEAO 2024, Central Bank of Egypt June 2025 and September 2026. Company results are the latest reported: Safaricom FY25 (year to 31 March 2025) and FY26 (year to 31 March 2026), MTN FY24 and FY25 (years to 31 December), Airtel Africa FY25 (year to 31 March 2025), Orange Q3 2025 and Q2 2026. Currency conversions are the source's own where stated. KES to USD uses about 130 shillings to the dollar, FCFA to USD about 590 francs to the dollar, and are labelled approximate.
Sources. GSMA, State of the Industry Report on Mobile Money 2026 (March 2026), 2025 (April 2025) and 2024, and The State of Merchant Payments in Africa (2026). World Bank, The Global Findex Database 2025 (July 2025) and Remittance Prices Worldwide Issue 54 (Q3 2025). Safaricom PLC annual report and financial statements for the year ended 31 March 2025 and FY26 results (2026). MTN Group annual financial results for the years ended 31 December 2024 and 31 December 2025. Airtel Africa results for the year ended 31 March 2025. Orange Q3 2025 and Q2 2026 results. Bank of Ghana Payment Systems Oversight Annual Report 2024 and Summary of Economic and Financial Data (2025). Bank of Tanzania Financial Stability Report (2024). Bank of Uganda Integrated Annual Report to 30 June 2025 and Quarterly Financial Stability Review (March 2025). BCEAO annual data on e-money in the WAEMU (2024) via Launch Base Africa. WAEMU Banking Commission annual report 2025. Central Bank of Egypt via Ahram Online and PAFIX (2025-2026). Central Bank of Kenya via Kenya National Bureau of Statistics and Communications Authority data (2024-2025). Ethio Telecom annual performance report 2024/25 and Safaricom Ethiopia FY26 results. Norfund (Wave debt financing, June 2025). CapFinch and Fintech News Africa (Wave scale, July 2025). IMARC Group, Africa Mobile Money Market 2026-2034; 6Wresearch, Africa Mobile Money Market 2025-2031. BCG and QED (March 2026) via Africa Financial Journal. NIBSS (Nigeria instant payments, 2024). And the African Exponent's own report on the GSMA 2026 figures, https://www.africanexponent.com/1-4-trillion-moved-by-phone-in-sub-saharan-africa-in-2025-about-two-thirds-of-all-mobile-money-on-earth/ and its news reports on mobile money in Uganda, Tanzania and Somalia.
Related reading on African Exponent. $1.4 trillion moved by phone in Sub-Saharan Africa in 2025: https://www.africanexponent.com/1-4-trillion-moved-by-phone-in-sub-saharan-africa-in-2025-about-two-thirds-of-all-mobile-money-on-earth/ Uganda implements new ID requirement for large mobile money transactions: https://www.africanexponent.com/uganda-implements-new-id-requirement-for-large-mobile-money-transactions/ Why mobile money users in Tanzania are returning to cash payments: https://www.africanexponent.com/why-mobile-money-users-in-tanzania-are-returning-to-cash-payments/ Mobile money platforms changing the financial sector in Somalia: https://www.africanexponent.com/mobile-money-platforms-changing-the-financial-sector-in-somalia/