Published: November 5, 2026
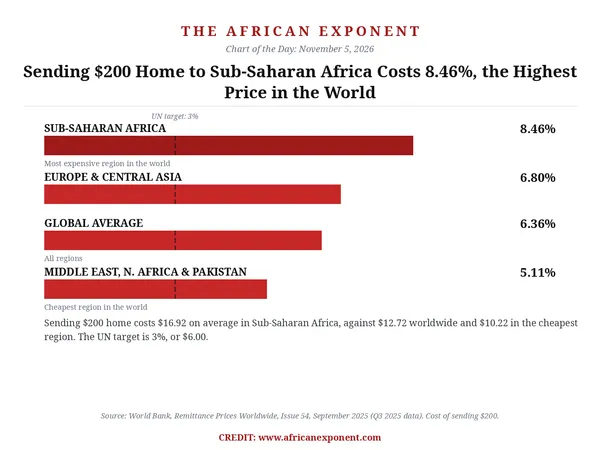
Sending money home is the most expensive in the world when home is in Sub-Saharan Africa. The World Bank puts the average total cost of sending $200 to the region at 8.46% in the third quarter of 2025. That is $16.92 lost to fees and exchange rate margins on every $200 sent.
The global average is 6.36%, or $12.72 on the same $200. Sub-Saharan Africa pays about a third more than the world average, and about two thirds more than the cheapest region, the Middle East, North Africa and Pakistan, at 5.11%, or $10.22. Sustainable Development Goal 10.c calls for average remittance costs below 3% by 2030. At 8.46%, Sub-Saharan Africa pays nearly three times that target, an extra $10.92 on every $200 against a $6.00 target cost.
The channel matters as much as the destination. Banks remain the most expensive way to send money anywhere, averaging 14.99%, or almost $30 on a $200 transfer, against 4.59% for digital services. And the worst corridors are concentrated in Africa: of the 13 corridors worldwide where sending $200 costs more than 20%, nine originate in Sub-Saharan Africa.
Why it matters
Remittances are not a side income for Africa. The diaspora sent about $95 billion home in 2024, more than underlying foreign direct investment that year. Every percentage point of cost is money that never reaches a household paying school fees, clinic bills or rent. Even a single percentage point across flows of that size is close to a billion dollars a year. The trend is moving the right way, slowly: the average was 8.78% in the first quarter of 2025 and 8.46% by the third. But at that pace, the 3% target stays years away, and the families sending the smallest sums keep paying the highest price.
There is a cheaper world inside the same data. The World Bank's SmaRT index, tracking the three cheapest services on each corridor, averaged 3.29% globally in the third quarter of 2025, close to the UN target. The problem is access, not absence: 20 corridors worldwide had no SmaRT qualifying service at all. Where competition and digital services have arrived, prices have fallen; where they have not, the old toll survives. Our ranking of the countries receiving the most remittances from the diaspora shows where the money lands. The cost of getting it there is the subject of this chart.
Data Sources
- World Bank, Remittance Prices Worldwide, Issue 54, September 2025 (regional averages, provider costs, SmaRT average, corridor counts).
- Citi Newsroom, SWIFT's faster payments are live in 17 countries, none are in Africa, October 2026 (same RPW release, identical 8.46% figure).
- ISS African Futures, Remittances as development finance: Africa's overlooked billions, August 2025 (Africa received $95.1 billion in remittances in 2024).
Methodology
The World Bank's Remittance Prices Worldwide database tracks the total cost, fee plus exchange rate margin, of sending $200 along 367 corridors from 48 sending countries to 105 receiving countries, using data from FXC Intelligence. Figures are for the third quarter of 2025, from Issue 54, published September 2025, the latest quarterly report published by the World Bank as of November 5, 2026. A Q4 2025 release was checked for on publication day and none has been published. Every derived figure in this post was recomputed from the published percentages before publication.